
Wellington tops Auckland for highest number of driving stop-starts per year
The latest research from Castrol and TomTom has revealed that despite the city’s countrywide reputation for notorious congestion, Wellington drivers experience more stop-starts than Auckland drivers.
|
|
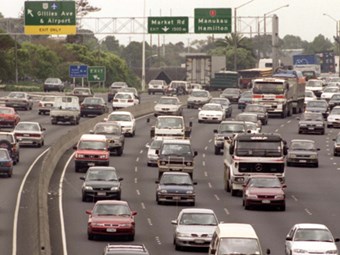
Auckland congestion
|
October, 2013: The latest research from Castrol and TomTom has revealed drivers in Wellington could experience an average of 9,480 stop-starts a year, surprisingly beating the average of Auckland drivers, despite the city’s countrywide reputation for notorious congestion.
Auckland drivers were found to experience an average of 9,360 stop-starts per year.
The study was carried out for Castrol by TomTom, using information from its satellite navigation systems on vehicles in 50 cities worldwide. The goal was to highlight the pressures that changing driving conditions place on vehicles across the globe.
Other cities in the study include Beijing with 28,200, London with 21,000 stop-starts, New York with 15,480, and Sydney with 13,200. Stop-start driving can increase microscopic wear in car engines and Castrol’s studies have shown that even a normal driver can experience as many as 18,000 stop-starts every year.
According to Castrol engineers, frequent stop-starts can cause increased wear to a car engine. The number of stop-starts reflect the driving conditions and situations drivers are facing in each market. These results show the size of the stop-start problem and indicate that precautions are necessary, one of the reasons why Castrol commissioned this study.
Castrol have identified three levels of stop-start driving, Green, Amber and Red (detailed below). Amber and Red warn drivers of heavy stop-start conditions which are likely to bring about serious stop-start wear to the engines. They will trigger drivers to take appropriate actions to fight against stop-start wear and protect their engines every time they start.
- GREEN: Moderate level of stop-start driving, as drivers are experiencing less than 8,000 stop-starts per year. Recommend drivers to take necessary precautions against stop-start engine wear.
- AMBER: Heavy level of stop-start driving, as drivers are experiencing 8,000 stop-starts or more per year. Drivers should take actions to protect against stop-start engine wear.
- RED: Severe level of stop-start driving, as drivers are experiencing 18,000 stop-starts or more per year. Drivers should take actions to protect against stop-start engine wear.
The project highlights stop-start driving, including traffic, urbanisation, and short journeys experienced in each area. Data from vehicles and trips within a region and time span was aggregated by TomTom, total driven kilometres and total number of stops calculated, and an average number of stops per driven km per region derived.
Gareth Bracchi, Senior Development Technologist at Castrol, says that:
"This project confirmed that drivers were making lots of stop-starts in their vehicles. In fact the numbers of stop-starts per year far exceeded our initial expectations – almost double in some cases! This highlighted that there are many more drivers out there that need the stop-start wear protection of Castrol MAGNATEC STOP-START."
Ralf-Peter Schäfer, Head of Traffic at TomTom, says that:
"The results from the Index are fascinating and working with Castrol to produce the Index has been very revealing. Istanbul’s highest stop rate among the big cities corresponds to its very high congestion level, followed by Moscow and Mexico City, certainly founded by heavy daily congestion as well. Traveling in Rotterdam however goes along with the lowest stop rate as the city has moderate congestion."
Castrol Magnatec Stop-Start Index 2013
|
City |
Total number of stops |
Average number of stops per vehicle per year |
|
Istanbul |
21,596,566 |
31,200 |
|
Mexico City |
17,999,273 |
30,480 |
|
Moscow |
1,385,513 |
29,520 |
|
Beijing |
64,941 |
28,200 |
|
Saint Petersburg |
429,908 |
28,080 |
|
Rome |
30,513,339 |
28,080 |
|
Jakarta |
522,073 |
28,080 |
|
Bangkok |
309,197 |
26,040 |
|
Shanghai |
252,607 |
24,960 |
|
Surabaya |
31,196 |
24,360 |
|
Guadalajara |
2,712,922 |
24,360 |
|
Milan |
25,534,082 |
23,040 |
|
Buenos Aires |
9,983,192 |
22,920 |
|
Manchester |
10,521,105 |
22,680 |
|
Madrid |
42,485,068 |
22,320 |
|
Amsterdam |
14,633,252 |
22,320 |
|
Sao Paulo |
102,189,603 |
22,200 |
|
London |
225,644,745 |
21,000 |
|
Barcelona |
41,199,071 |
20,400 |
|
Kaohsiunga |
2,150,839 |
20,280 |
|
Taipei |
8,113,321 |
20,040 |
|
Johor Bahru |
467,398 |
19,800 |
|
Hong Kong |
862,288 |
19,680 |
|
Cordoba |
473,588 |
18,120 |
|
Ankara |
5,963,224 |
17,880 |
|
Paris |
296,090,725 |
17,520 |
|
Phuket |
18,391 |
17,400 |
|
Warsaw |
7,075,404 |
16,200 |
|
Rio de Janeiro |
19,517,721 |
16,200 |
|
Berlin |
48,478,293 |
16,200 |
|
New York |
62,028,327 |
15,480 |
|
Krakow |
2,298,441 |
13,800 |
|
Stockholm |
5,110,227 |
13,680 |
|
Singapore |
9,610,879 |
13,680 |
|
Sydney |
45,550,971 |
13,200 |
|
Vancouver |
7,216,008 |
12,600 |
|
Lyon |
26,042,523 |
10,920 |
|
Hamburg |
28,564,290 |
10,800 |
|
Dubai |
282,844 |
10,200 |
|
Kuala Lumpur |
1,798,523 |
9,960 |
|
Johannesburg |
40,088,722 |
9,840 |
|
Wellington |
956,014 |
9,480 |
|
Auckland |
6,466,118 |
9,360 |
|
Los Angeles |
17,898,857 |
9,000 |
|
Melbourne |
35,979,611 |
8,760 |
|
Cape Town |
9,699,280 |
8,760 |
|
Toronto |
20,024,752 |
8,520 |
|
Goteborg |
1,849,933 |
7,800 |
|
Abu Dhabi |
169,795 |
6,840 |
|
Rotterdam |
16,180,627 |
6,120 |
For the latest reviews, subscribe to our Deals On Wheels magazine here.
Keep up to date in the industry by signing up to Deals on Wheels' free newsletter or liking us on Facebook.
.jpg)


.jpg)

.jpg)